Case Study: Reagent With Macro Help
The question came up whether something like the grove << fragment macro could apply to any of the CLJS react wrappers? I said yes, and didn’t really want to get into it. Curious as I am though that question nagged at me and I wanted to know for myself. So, since I’m preaching about Lessons learned and not really wanting to talk about shadow-grove, let use talk about reagent for a bit. I don’t want to put reagent in a bad light or anything, I want to highlight how much optimization potential is left within easy reach.
Given that I have already written the actual << macro, how hard could it be to translate this to reagent? To do an actual proper implementation I can’t really say. Something basic that would satisfy my basic testing setup? Not that hard. Of course, this isn’t nearly as comprehensive as the React Compiler would do, and neither is it supposed to be. I just wanted to test whether this actually provides any kind of speedup at all.
TL;DR: Yep, it gets faster.
Reagent Baseline
I have to emphasize that this setup isn’t anything close to how you are actually supposed to use reagent. This is intentionally naive and probably breaking some rules. I wanted this to measure against React 19 and I don’t even know if that is officially supported by reagent. I did the same testing methodology as my previous post. Some basic hiccup, turned into react elements which then get rendered by react. I was shocked how slow this is during development. Like, 90ms without any slowdowns. Which emphasizes the fact that creating very large hiccup structures is bad. I know I should have used components and not actually do everything as on big hiccup structure. But this was only during dev, release actually looks much more reasonable. Reaching about ~1.6ms with no slowdowns, but what about 20x slowdown?
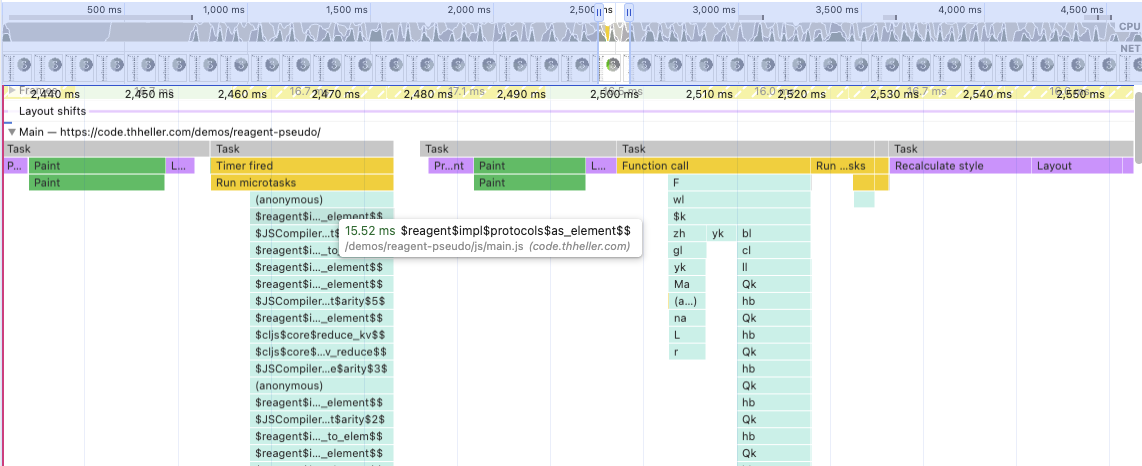
Due to react not rendering when I tell it to, but rather delaying itself the trace is actually split in two. One is the actual reagent/as-element call, which converts the hiccup to react elements. And then a bit later actually react rendering it.
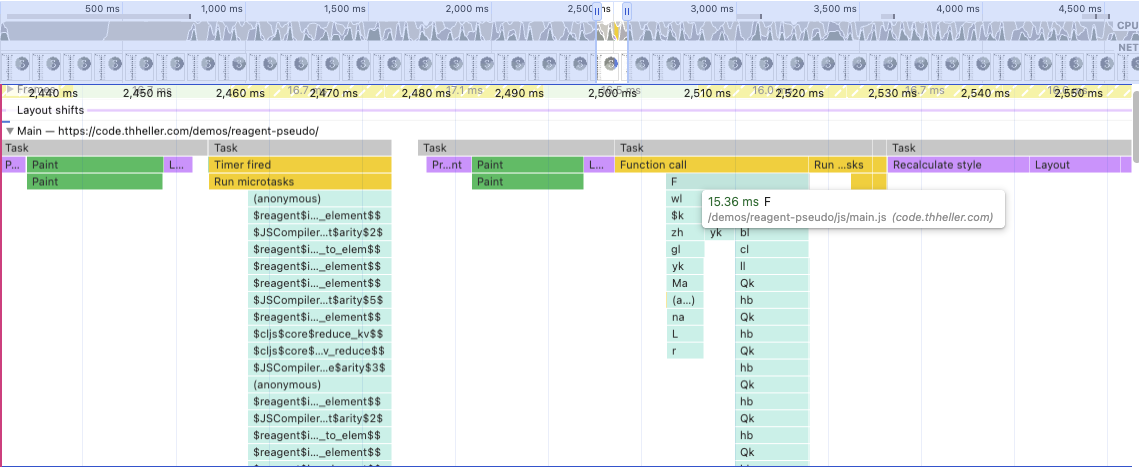
So ~31ms, but with a bit of variance. Seems the go between 20-40ms, in rather unpredictable ways.
Regardless, as always feel free to get your own numbers via the demo page.
Reagent With Macro Help
Same as in my earlier post, the only real change was wrapping all hiccup forms in the << macro I wrote. This macro does two things.
First, it tries to find completely constant parts of hiccup that it can pull out and “memoize”. In the example code that for example the entire :div holding the :svg, as well as the :thead bit. These only get created once, so the hiccup->react element conversion is only done once, and react finds identical? elements and I assume skips some work.
Second, using the same strategy the macro in shadow-grove uses it analyzes the hiccup and looks for dynamic parts. So, for example from this bit:
[:tr
 [:td {:class $col-num}
  (:id row)]
 [:td {:class $col-num}
  (format-temp (:target row))]
 ...]
It identifies the $col-num as “constant”, since it is a def in the local namespace, but (:id row) and (format-temp (:target row)) are code blocks. Code needs to actually run, so instead it basically creates references to these things. Simplified it generates a function for this instead, that roughly looks like
(def memo-fn1
  (make-memo-fn
    (fn [[a1 a2]]
      (as-element
        [:tr
         [:td {:class $col-num} a1]
         [:td {:class $col-num} a2]
         ...]))))
In the place of the actual fragment, it then emits a call to a helper function, which will eventually call the above function, but also memoize it based on the passed data vector.
(use-memo-fn memo-fn1 [(:id row) (format-temp (:target row))])
The two helper functions you can find here. Admittedly naive and all full of bugs, but to be quite honest I don’t care about react at all, so the only goal here was to find out if this all can actually apply to reagent with any meaningful benefits.
Running this variant again with a 20x slowdown looks something like this:
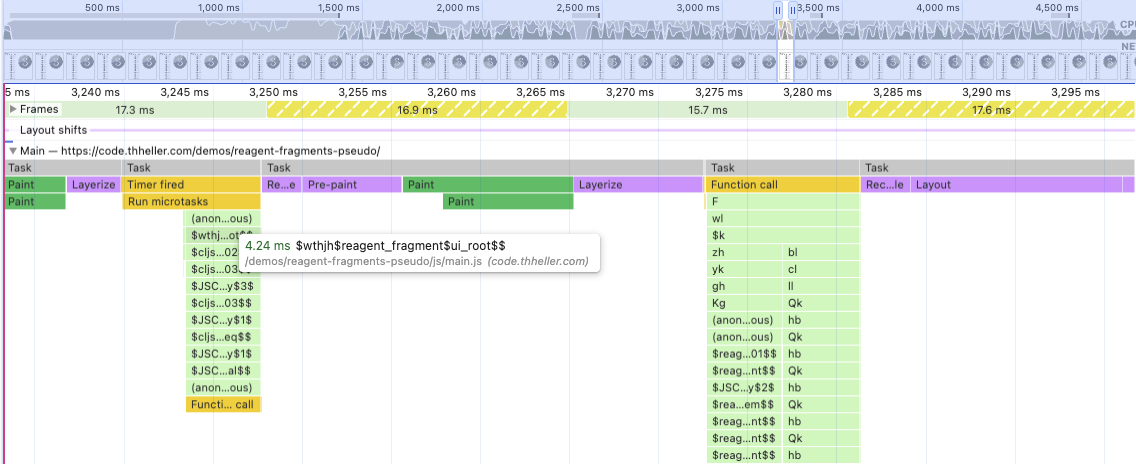
Again, react still runs when it wants, and as you can see there is now some as-element conversion happening as part of the react expansion. You’d have this normally anyway due to the introduction of some intermediate “components”, but it makes it a bit harder to distinguish where actual time is spent now. No longer has clear boundaries between reagent/react, but that is fine, you’d never have that in the first place if not for my deliberate test setup.
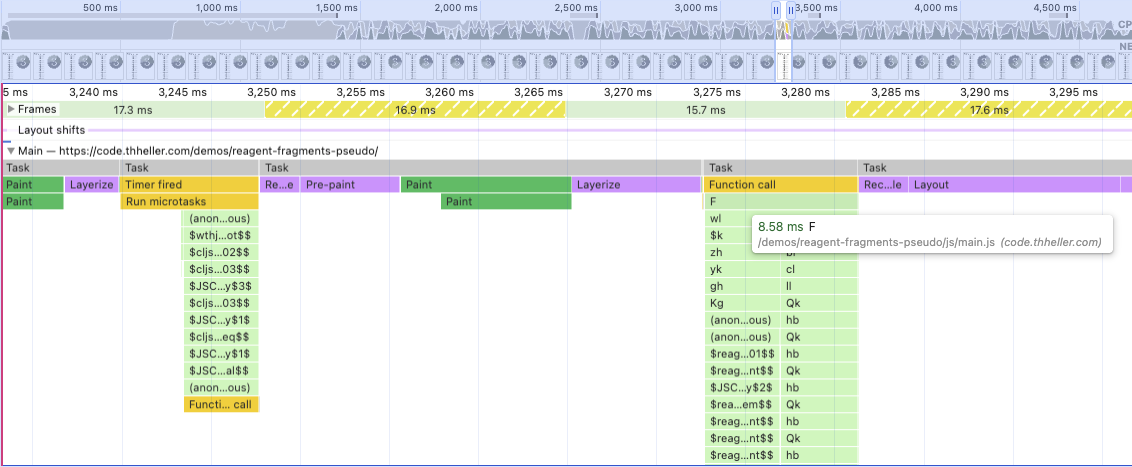
Either way that is ~13ms, again with quite a bit of variance, but still a measurable difference. Not too bad for a couple of hours of macro tinkering.
Conclusion
Should you use this? Absolutely not. This was only to satisfy my own curiosity. I’m almost certain that some of the other CLJS wrappers do something similar or smarter already. It has been many years since I actually used react myself and I have no interest in turning this into a proper library, or actually optimizing this to its full potential. I’m satisfied to have some evidence that these ideas actually do apply.
Again, I know that I could have gone with a few simple components and probably get about the same or better speedup with that. The goal was testing whether introducing a macro can help “fix” my naive approach.
If done properly you could do what React Compiler does completely within a macro, with no extra help from the compiler at all. And quite honestly anyone using react via CLJS probably should. Otherwise, future comparisons between CLJS and React-Compiler-compiled JS will look embarrassing, even more than they currently already do. Maybe I’m wrong and the React Compiler will actually be usable with CLJS in some way, but I have my doubts, especially since I have no clue how I’d integrate it with shadow-cljs.
Happy to discuss this with anyone equally performance obsessed. ;)