What The Heck Are You Talking About?
In my previous What The Heck Just Happened post I outlined some of the problems I see in react-like web frontends. I didn’t present any actual numbers though, so this is all about those numbers and my general approach to evaluate performance behavior. I will only present data using my own code, since it is not my business to criticize the work of others. I still kind of do though, so sorry about that.
While optimizing shadow-grove I used the popular js-framework-benchmark to get some rough estimates on how shadow-grove holds up. You can look at the journey that took here. Nobody is going to update something 10.000 times in row with no pause in real apps. It does highlight some common bottlenecks in implementations, so it does have its uses, but I want a more practical perspective.
What I want to focus on in this post however is something closer to real world. Of course still totally made up by me this morning, but still something I might write for myself at some point. At home, I have a home assistant instance running to monitor/control all the “smart home” things. I’m not very happy with it overall, but it gets the job done fine and most importantly without much work on my end. I have been playing with the idea of making my own dashboard though. I haven’t actually done this yet, but I might.
So, the setup is that I start with a table of climate sensors. They have a target temperature the system should have, a current temperature, the current state and a last update timestamp. Simple enough data model. I haven’t connected this to anything yet, I just made up some stuff and randomly update it. Point being that this extremely naive and dumb example is already 2k+ DOM elements.
You can marvel at it here, with the source code available on github. Don’t expect too much.
Methodology
The UI is completely naive and dumb on purpose. Basically I generate 100 sensors, then every 100ms I randomly update one sensor. That is all rendered as a table. On the side there is a very simplistic SVG animation, which shadow-cljs users might recognize. The only purpose of that is to make it very easy to recognize when things begin to stutter and also to just give the browser something to do with a fairly constant “load”.
I then just let it run, open the chrome devtools, open the Performance tab and hit “Record”. I then let it run for a bit and then look at the resulting graphs.
I made two variants of this, one is pure interpreted hiccup, which should look very familiar to anyone having used hiccup before. No bells and whistles whatsoever. Just takes all the state from the root, creates hiccup and renders it. No components, no memoization, nothing at all.
The other is using grove fragments. Still just rendering from the root with no components or memoization. If you compare the two you’ll find that the only difference is that all hiccup is wrapped in (<< [:hiccup-goes-here]). Nothing else changed.
For each I tested the release optimized version. I uploaded a few variants so you can try all of this yourself. Don’t trust my numbers, check them yourself.
The -pseudo variants were compiled with the npx shadow-cljs release interpreted --pseudo-names flag, and basically just make it a little easier to actually figure out what code we are looking at. Makes the build a bit larger, but performance will be more of less identical to the regular release build.
The Baseline
This was using the interpreted-pseudo version and I just recorded a little bit in chrome with no slowdown whatsoever. So, the raw hiccup variant.
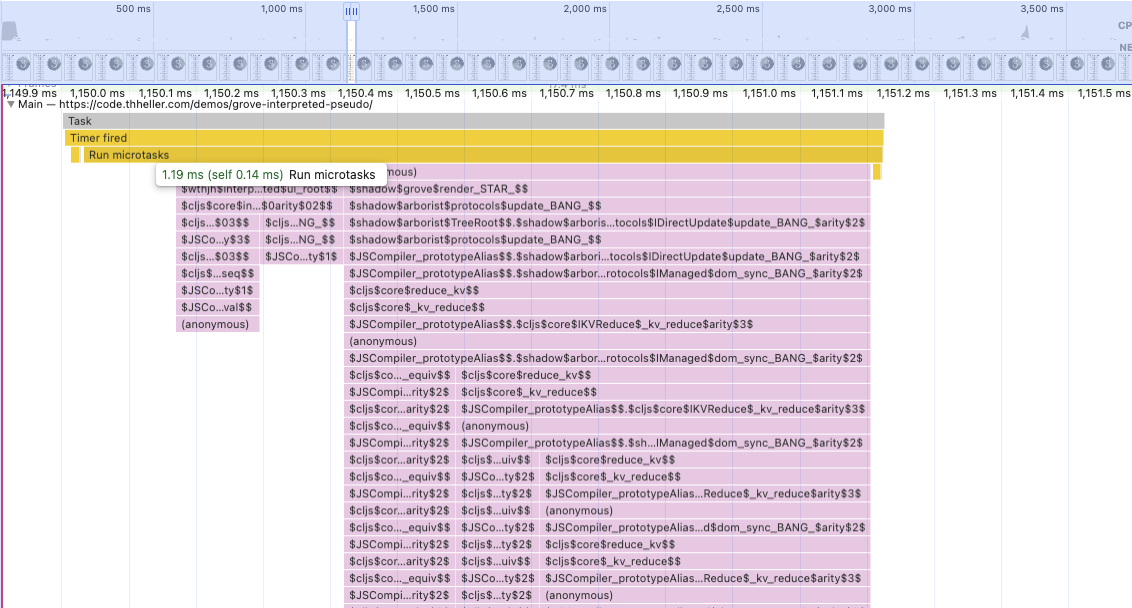
This is about what you’ll see when zoomed into one particular “update”. You might see the 1.19ms and think to yourself: “What the heck is he even talking about, this is fast enough”. And you’d be absolutely right. ~1ms for about the slowest way I can think of building this is fast enough. To be honest I was surprised it was this fast. The m4 pro mac mini is absurdly fast in this regard. You really have to zoom in a lot to even see it.
But, let’s keep digging a little. The astute observers may recognize a lot of equiv references in that graph. This is the algorithm doing the hiccup diffing. It is split into 3 blocks, the first is updating the data, the second is the call to ui-root and then the render Overall this is still very fast, so we have nothing to worry about right?
To be extra clear, what follows next is for the extra nerdy. You’d be absolutely fine to accept this and move on with your life. I wouldn’t blame you. I don’t know how much time I have wasted in my life looking at graphs like this.
Making Things Slow
Not everyone is using a m4 pro or other computer of that level. So, assuming that everyone is on absurd hardware like this is bad IMHO. So, I don’t even usually run things without slowdown. I usually stay at 4x, but to make things a little more apparent I had to go do 20x for this. Yes, 4x was still “fine”.
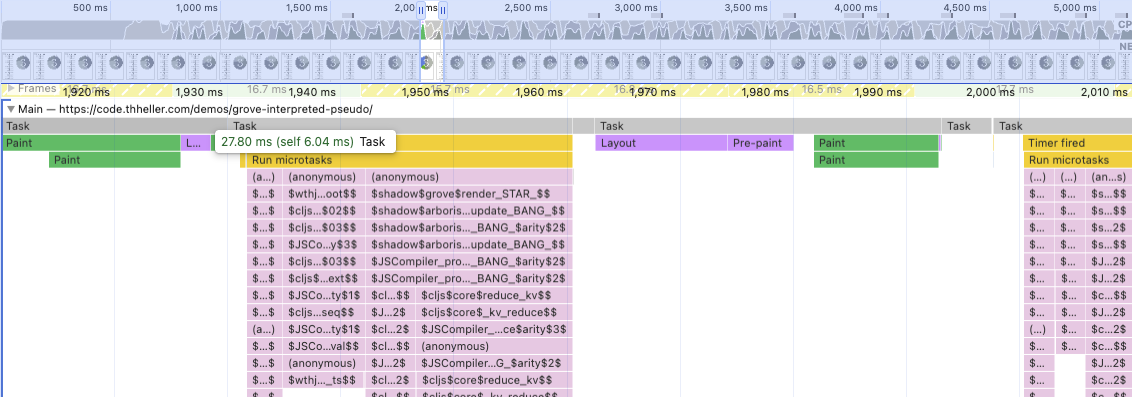
Things look a little bit more dire here. We are up to ~28ms per “update”. The SVG animation is noticeably choppy. About 8ms is spent on ui-root, 17ms on render and the rest for the data update. Meaning even if you removed all other work, just the render alone is blowing the 16ms frame budget you’d need to get to 60fps. The app didn’t even do any actual work, and we still can’t reach 60fps.
If you ask me that is bad. This is still a purely theoretical and made up scenario, but it shouldn’t seem too outlandish. Yes, the structure of the hiccup is naive. Inlining the SVGs like that is not ideal, and you could optimize things way more. The point is that you can end up with something like this very quickly and its already 2k+ DOM elements (not even counting the #text nodes). I don’t have 100 climate sensors in my home, and I don’t need updates every 100ms, but that is not the point.
How likely is it for users of library X to end up in a situation like this? I’d go as far as to say it is the norm in anything react-based. That is why the React Compiler stuff is so critical in the JS world IMHO. Optimizing all this by hand is tedious and no fun at all. It is also very hard to even “find”. Again, Death by a thousand cuts …
Let Macros Do The Work
Next up is the fragments-pseudo variant, so using the grove << fragment macro. No longer working with actual hiccup, just using the syntax. The macro in fact just generates the code to create the DOM elements and apply direct updates only. It only compares the data passed into it, no actual DOM nodes.
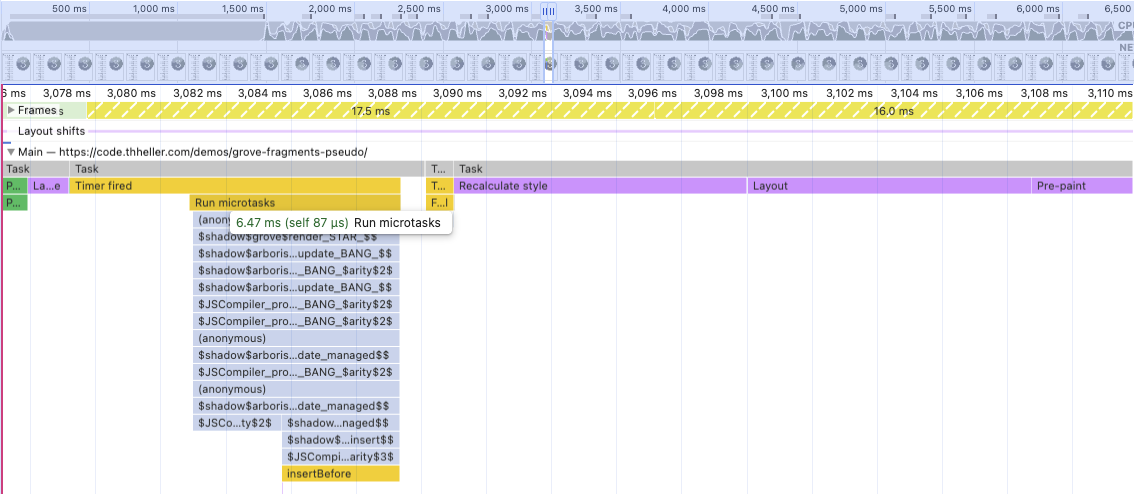
Back to 6ms per “update”, even at 20x slowdown. The ui-root call doesn’t even show up, neither does the data update for reasons I cannot explain. However, you might also notice that there is this yellow insertBefore block at the bottom. That means that about half of that total update time was spent in browser native code. In this case that is one of the SVGs being swapped/created. The other stuff doesn’t even show up.
Only by using << this bought the app 10ms to do actual work instead and still stay within 16ms. Even if you just compare the “depth” of the trace with the hiccup variant you should see how much less work is done overall. Please look at an actual graph in the devtools, the screenshots don’t show the depth accurately.
Conclusion
I’ll repeat. Do not trust my numbers. Just try for yourself, and more importantly on stuff you actually care about.
I hope to have shown how I approach and think about these things. Real world projects look very different from this, and it is not always easy to come up with these test scenarios.
The hiccup implementation in shadow-grove isn’t even all that good, yet it is still “fast enough”. I personally don’t believe in “fast enough”, but going to 20x slowdown is also a bit extreme. However, my old Surface Go Tablet from I don’t even know when stutters without any slowdowns. So, it is safe to assume it is actually 20 times slower than my m4 and I may use it for my home dashboard in the end.
In the end it all depends on who is looking at your “apps” and what hardware they might be on, but even for my m4 I’d like to reduce the amount of work it has to do to a minimum. Especially if I barely have to change my code to get there.
This is still just scratching the surface. I have already gone way deeper than this in grove and plan to talk about some other things in more detail in future posts. Even though I still don’t really want this to be about shadow-grove. Just the lessons I learned while building it. The macro approach will never have this kind of impact on anything react based, so YMMV, but there are still gains to be had, which some libs already take advantage of.